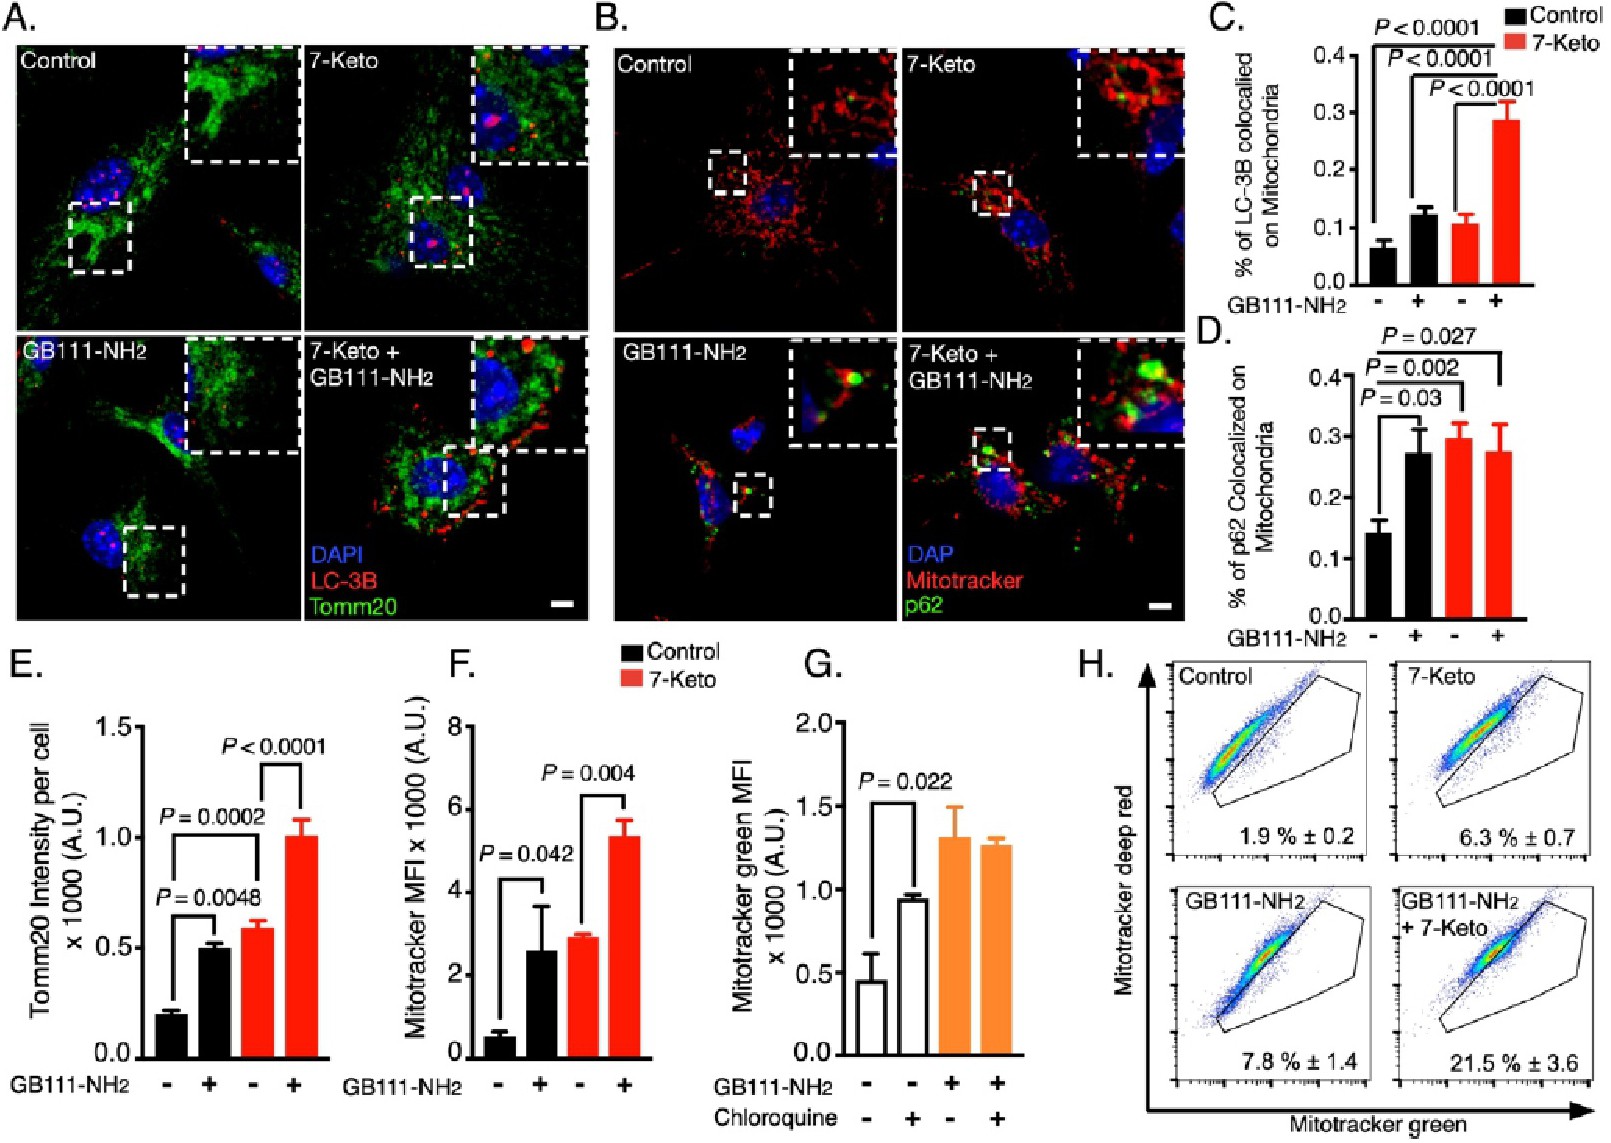
Fig. 4. Mitochondria are targeted for autophagic degradation by 7-Ketocholesterol (7-Keto). (A) Primary BMDMs were treated with GB111-NH2 or DMSO for 16 h and then 7-Keto or vehicle were added for another 4 h. BMDMs were fixed and stained with LC-3B (red), Tomm20 (green) and DAPI for nuclei (blue). (B) BMDMs were treated as described in (A) and stained for p62 (green), mitotracker deep red (red) and DAPI (blue). (C, D) Colocalization analysis of LC-3B-Tomm20 and p62-mitotracker deep red, respectively. The data represent a summary of three independent experiments and one-way ANOVA with Tukey's correction for multiple hypotheses used to assess statistical difference. (E) Quantification of Tomm20 signal intensity from BMDMs treated with 7-Keto for 8 h after GB111-NH2 pre-treatment, as described in panel A. One-way ANOVA with Tukey's correction for multiple hypotheses used to assess statistical significance. (F) Flow cytometry analysis of mitochondrial mass. BMDMs were treated with GB111-NH2 or DMSO, as described in panel A and then stimulated with 7-Keto for another 4 h. During the last 30 min, mitotracker green was added and the cells were analyzed by flow cytometry. The data are summarized over three independent experiments and one-way ANOVA, with Sidak's correction for multiple hypotheses was used to assess statistical significance. (G) Flow cytometry analysis of mitochondrial mass, as described in panel F. BMDMs received chloroquine for 2 h prior to analysis. The data represent a summary of three biological replicates with one-way ANOVA, with Sidak's correction for paired comparisons. (H) Mitochondrial damage assessed by flow cytometry analyses. BMDMs were treated as described in (F) and stained with mitotracker green and mitotracker deep red prior to analysis. The gates represent cells with damaged mitochondria and the results are expressed as percentages of the total population. The data represent three independent experiments. Bar graphs present the mean ± SEM.